


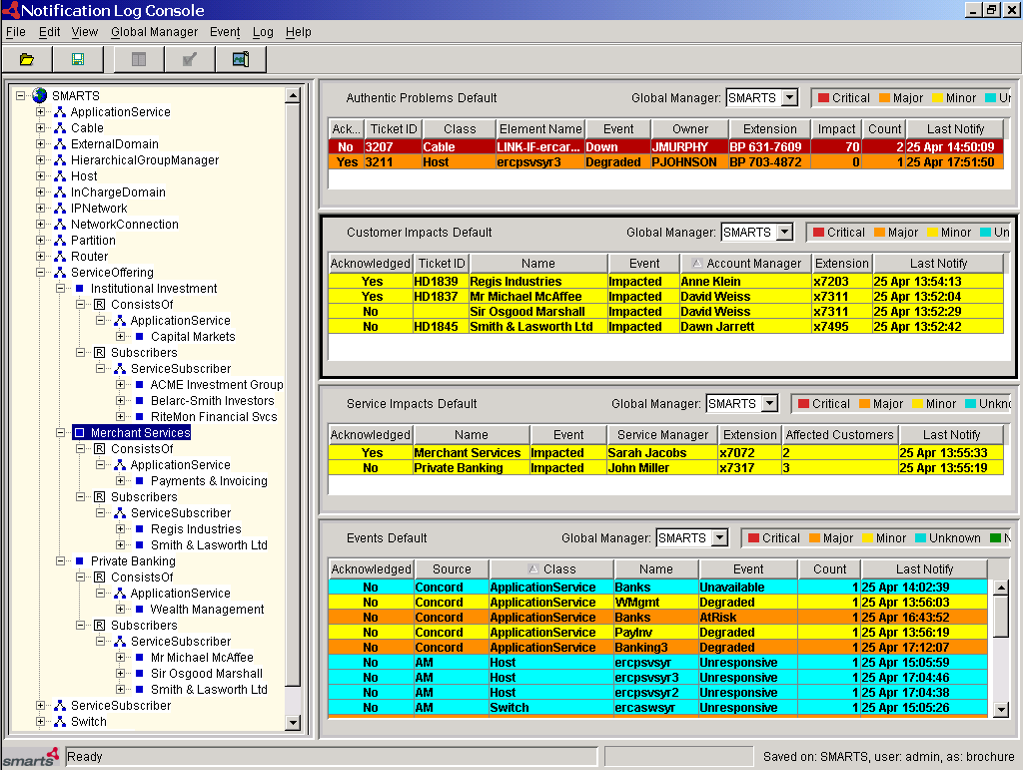
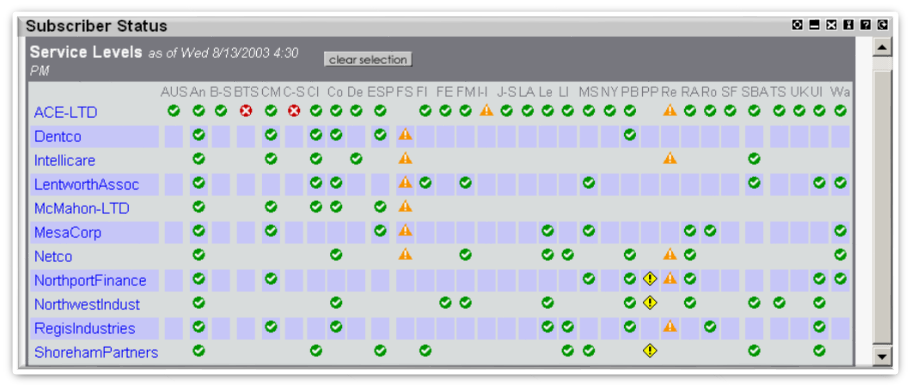
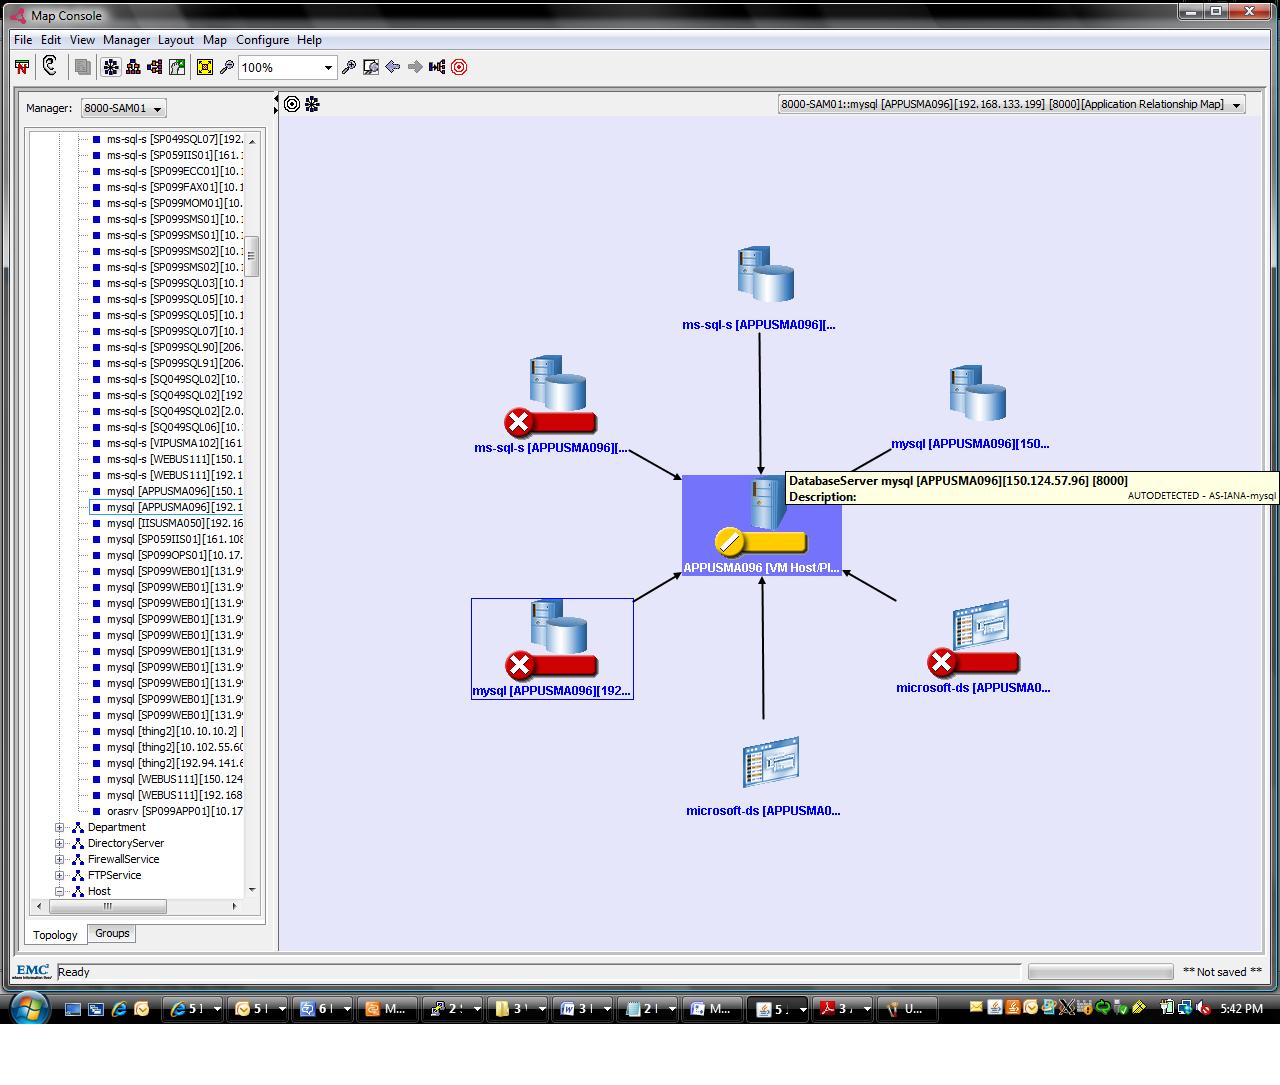
service dashboard
unified data at all layers of business
Has your IT infrastructure team grown beyond the basic “Collect and Report” capabilities available in products like Nagios, Solarwinds, Microsoft SCOM, etc?
- Service Dashboard aligns performance and fault data to deliver a unified perspective for the business stakeholders, IT, and Operations.
Too much data, too many tools? Not leveraging the tools you have? Don’t know what to do with it all?
- Investments can run deep in operational tools, & continue to proliferate in support of data lakes, cloud offerings, converged infrastructure, etc..
- Service Dashboard can help you achieve value from those investments by using the data more effectively to predict and prevent service impacting issues across IT silos. Service Dashboard makes data actionable.
Benefits
- Improved customers perceptions and experience
- Reduce ticket and event counts
- Reduce downtime and cost of outages
- Turn Operations into a proactive, responsive machine
- Provide teams the ability to quickly identify a root-cause
- Leverage existing sources of data more effectively
- Capitalize on previous investments by transforming data into actionable information
- Improve operations and take control of the organization.
- Know the real story on how your apps are serving the business
- Scale with the Enterprise
The Results
The results are real and you don’t have to wait months for them. Service Dashboard is quick and easy to use and simplifies OSS orchestration efforts across and between IT and business operations.
- Identify key trends on business service 'health’. Go beyond the CPU graph or simple IT metric. Holistic visibily into how the IT infrastructure is actually serving the business.
- The executive teams finally get the reports they've been asking for... and they are on-time!
- An exceptional end user experience that doesn’t require an engineering degree to use.
- Better decisions around technology spend and operational support.
- Improved levels of service and better response from support.
- Simplified visibility into infrastructure, applications, and the hybrid environments of today.
- Real-time insight into the operational effectiveness of fault management, ticketing, and remediation.
Give us a call
Give us a call to discuss how Service Dashboard is helping organizations simplify visibility into business applications and infrastructure, including converged and hybrid Cloud environments.

 Partner-Reseller
 Partner-Reseller